
Modbus RTU, ASCII and TCP with SerialTool
Last updated on by Oliver ReedWhat is Modbus
The Modbus protocol is a serial communication protocol created in 1979 by Modicon® (a company now part of the Schneider Electric group) to enable communication among its programmable logic controllers (PLCs). It has become a de facto standard in industrial communications and is currently one of the most widely used connection protocols in the world among industrial electronic devices. Modbus is a royalty-free protocol whose specifications are published on the The Modbus Organization website.
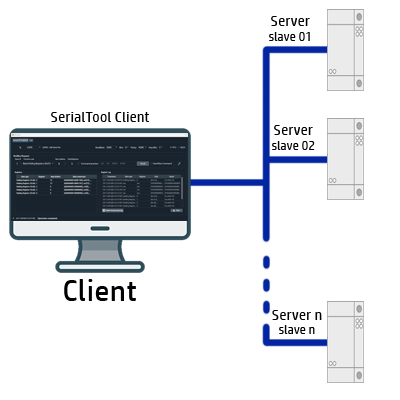
In simple terms, it is a method used to transmit information over serial lines between electronic devices. The device requesting the information is called the Modbus Client, and the devices providing the information are Modbus Servers. In a standard Modbus network there is one client and up to 247 servers, each with a unique server address from 1 to 247. The client can also write information to the servers.
Originally intended for industrial use, over time this protocol has also been adopted in other sectors, becoming one of the most widespread. Even today, despite being more than 40 years old, it is still available in many devices, such as operator panels, PLCs, home automation systems, and even simple devices like Arduino.
Modbus RTU and ASCII Transmission via Serial
When the protocol was created, communication was designed to operate over a serial port, and for this reason it has been implemented in SerialTool. Modbus is often used to connect a supervisory computer to a remote terminal unit (RTU) in supervisory control and data acquisition (SCADA) systems. Depending on the format used to transmit data, the protocol is divided into:
- MODBUS RTU - data is transmitted in hexadecimal format.
- MODBUS ASCII - data is transmitted in ASCII format.
Error checking differs in the two cases: in MODBUS RTU, a CRC (Cyclic Redundancy Check) appended to the commands is used, while in MODBUS ASCII an LRC (Longitudinal Redundancy Check), also sent after the commands, is used.
Modbus TCP Transmission
In 1999, “Modbus TCP” was developed, a standard dedicated to networks that use the TCP/IP protocol suite: in practice it is a serial RTU-based version of Modbus built on TCP/IP, which enables communications over Internet/intranet networks. In recent years the TCP/IP version has been used more and more because it is Open Source, easy to implement, low in development cost, and requires very little hardware support.
Error checking differs in the two cases: in MODBUS RTU, a CRC (Cyclic Redundancy Check) appended to the commands is used, while in MODBUS ASCII an LRC (Longitudinal Redundancy Check), also sent after the commands, is used.
The Modbus TCP/IP protocol uses binary data encoding and the TCP/IP error detection mechanism. Unlike serial Modbus, the TCP/IP version is connection-oriented and allows concurrent connections to the same slave or to multiple devices. Modbus TCP/IP also uses the master-slave paradigm; this communication additionally uses four types of message.
Modbus is positioned at Level 7 of the ISO/OSI stack (Application Layer), defining message formatting called framing and the method of transmitting data and control functions. Communication takes place through the client-server paradigm. The protocol defines a Protocol Data Unit (PDU) that does not depend on the underlying communication layer. The Application Data Unit (ADU) introduces additional fields for addressing and error control.
SerialTool Modbus Client (Master / Polling)
SerialTool is a Modbus RTU, ASCII and TCP client with polling, register scanning, traffic monitoring and live charts for testing and debugging industrial devices.
The Modbus Client allows you to connect to a Modbus Slave/server device via Serial (RTU or ASCII) or Network (TCP over IPv4 or IPv6), read and write data using standard Modbus functions, and create a Modbus device with its own mapping on which scheduled polling can be performed.
Within the prototype device it is possible to add Modbus structures (Discrete Output Coils, Discrete Input Contacts, Analog Input Register, Analog Output Holding Register) and save the device so that it can be reloaded whenever necessary. The Modbus prototype device can also be exported in Text, CSV or PDF format to be shared in a simple and intuitive way.
Once a device with the correct mapping has been created, it is possible to display real-time charts with the values read directly from the Slave device by means of scheduled polling.
SerialTool also provides the ability to view Modbus traffic (Serial and TCP) in a dedicated terminal for generated and received traffic. The advanced terminal supports data export and real-time filtering of incoming and outgoing data.
SerialTool also provides the ability to scan the remote Slave device through the Modbus Scanner function. By setting the correct filters, you can attempt to map the remote device (Modbus Slave) even without knowing the registers currently supported. The Modbus Scanner function is particularly useful when you want to explore a device whose characteristics are unknown or only partially known.
Below is the main screen of the SerialTool Modbus module:
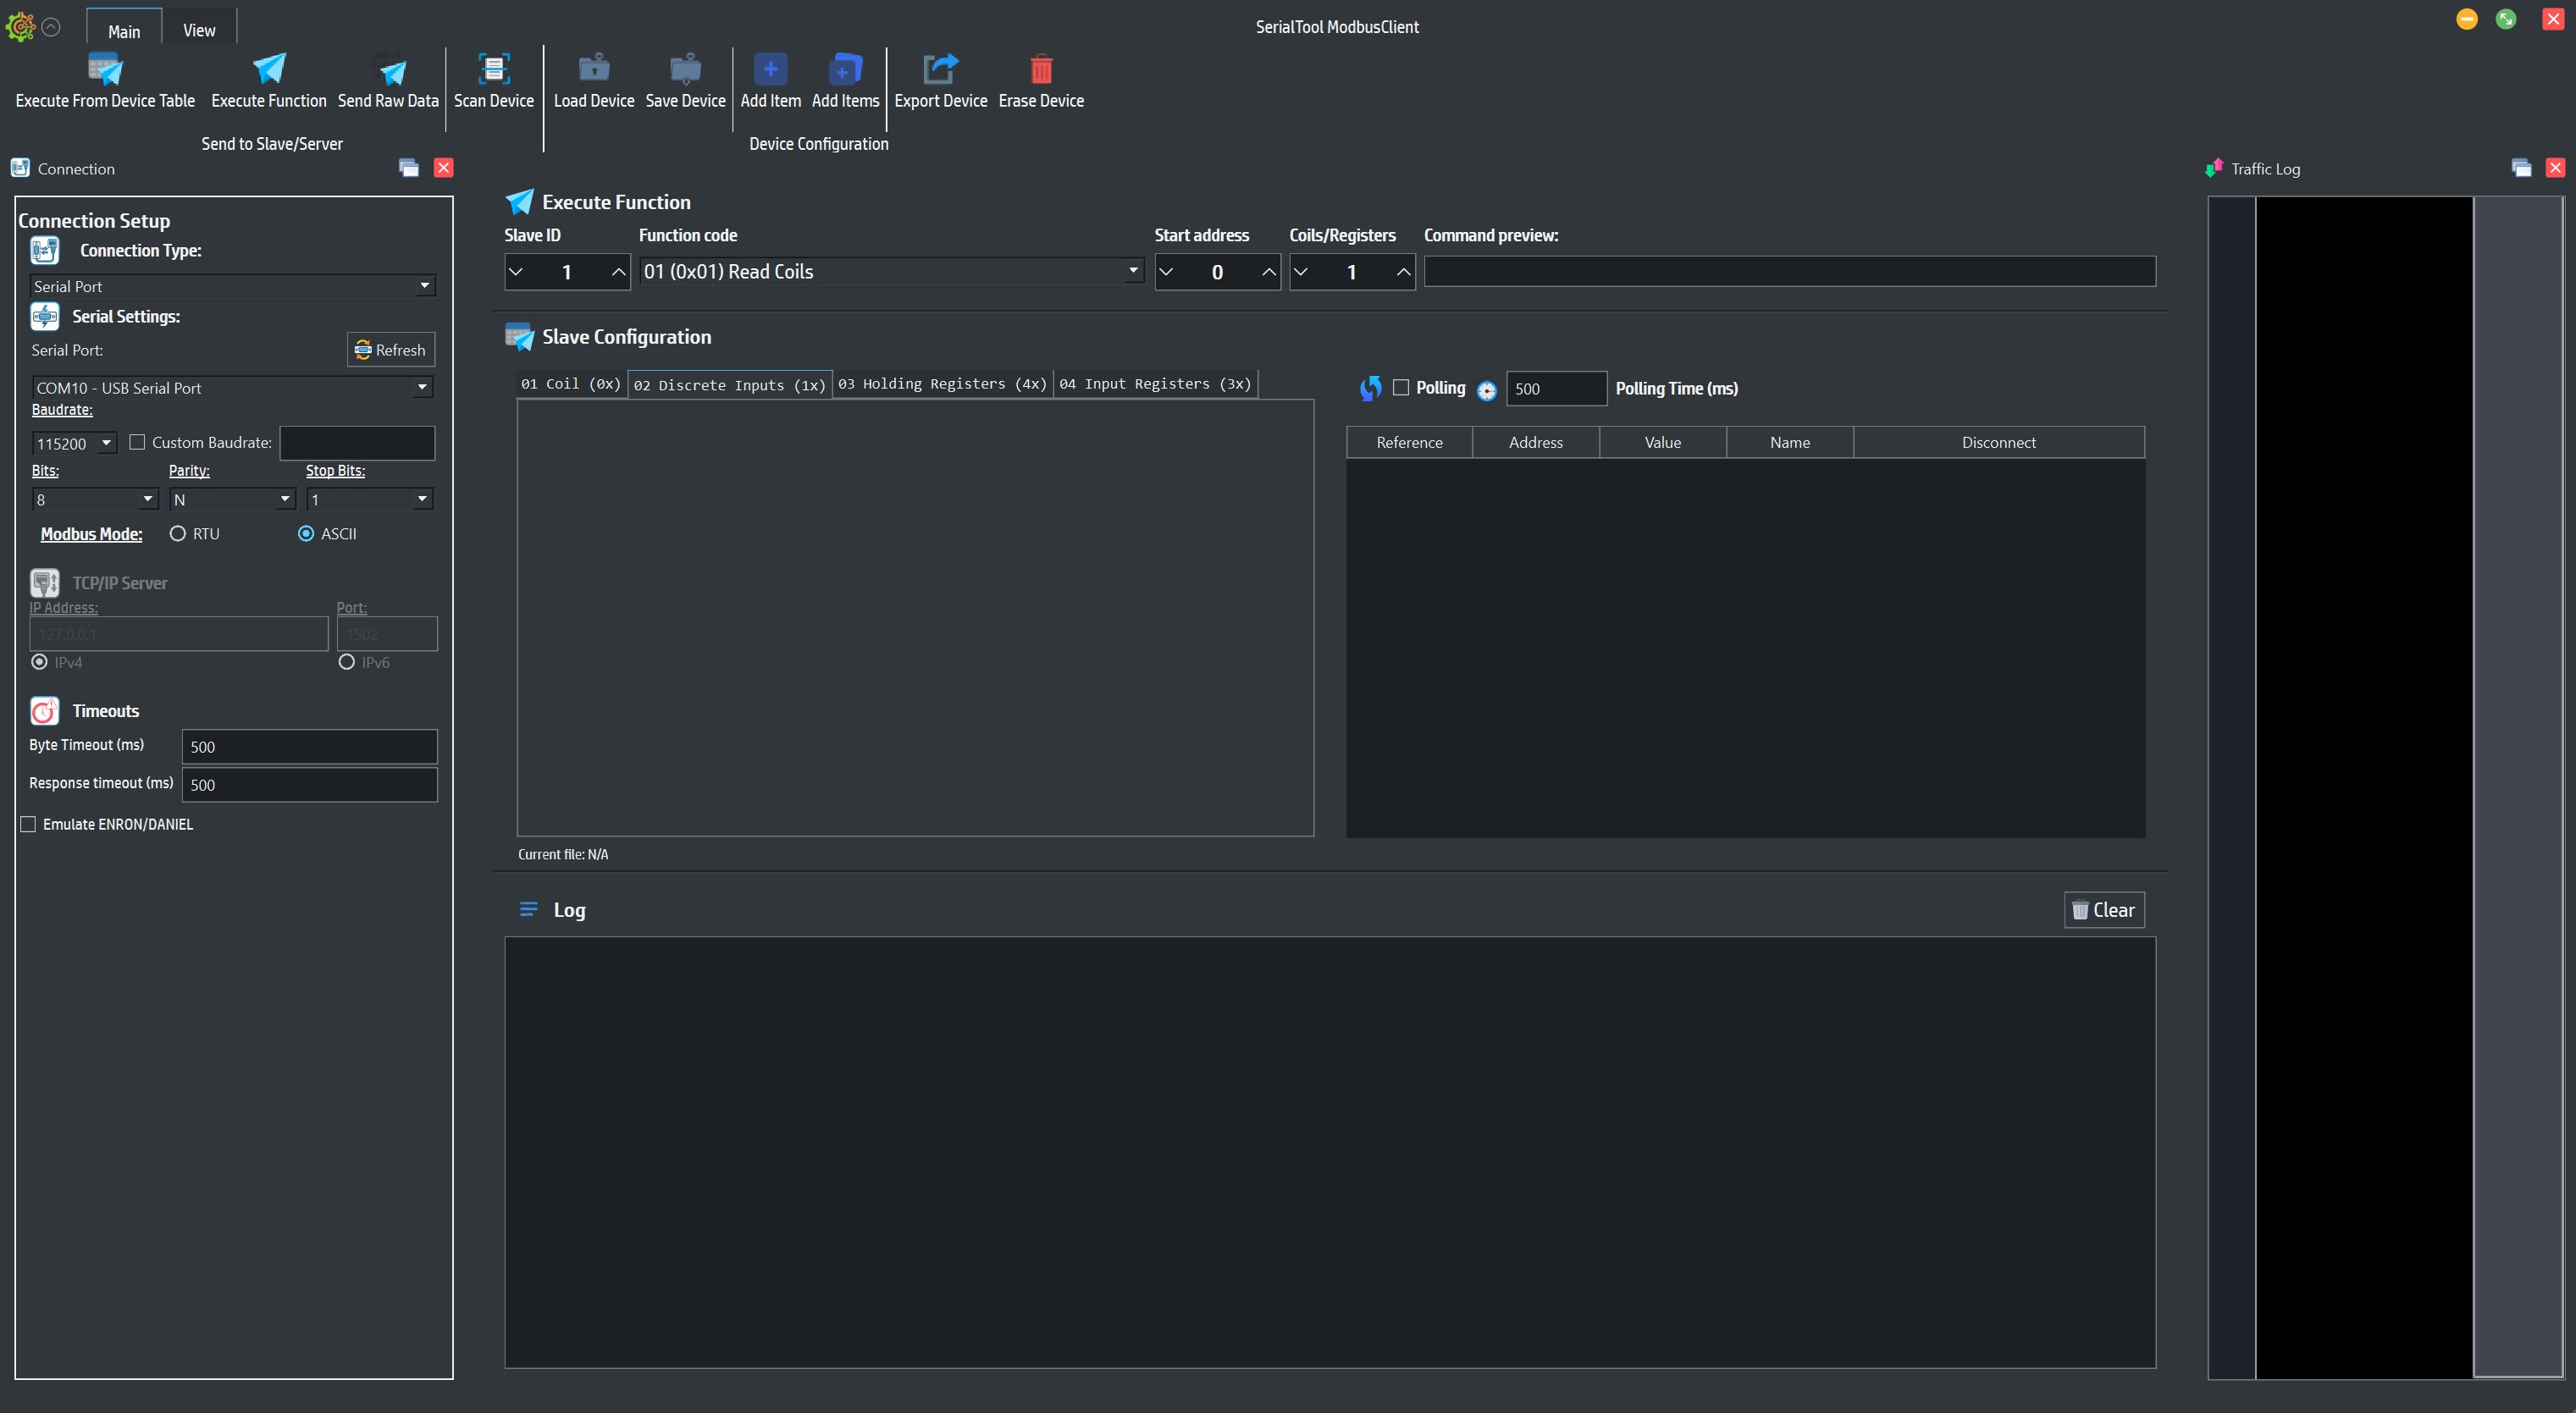
Main screen of the SerialTool Modbus Client
The main screen highlights the key features of SerialTool and the Modbus Client (Master).
SerialTool Modbus Client (Master / Polling)
On the left side of the screen you can choose Serial or TCP connection mode:
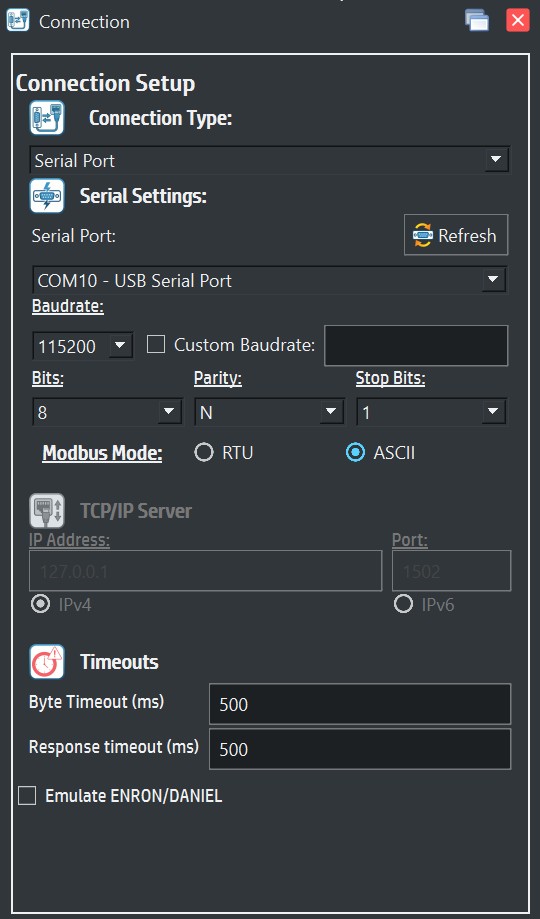
Modbus Client Connection screen
As stated above, the serial Modbus protocol is divided into two types: RTU and ASCII. To communicate correctly with the remote device, in the case of a serial connection it is essential to know which type of Modbus protocol is supported by our Slave device.
ModBus TCP connection, on the other hand, supports IPv4 and IPv6. To set up the Modbus connection via TCP, you need to set the slave IP and the remote port to connect to.
On the connection screen there are two parameters for the response timeout that the Modbus Slave device must provide.
A generic response timeout (Response Timeout), after which the Client (Master) stops waiting for the response from the slave, and a timeout from the last byte received from the Slave.
Modbus ENRON/Daniel Emulation
Among the connection parameters there is ENRON/Daniel emulation (often simply called Enron Modbus or Daniels Modbus), which refers to a specific variant of the standard Modbus communication protocol.
It was originally developed by Enron Corporation and widely implemented in the flow computers of Daniel Measurement and Control. Over time, it became a de facto standard for electronic fluid measurement (EFM), particularly in the Oil & Gas sector.
Enabling ENRON/Daniel emulation on a device changes Modbus behavior to support the following key features:
- 1. 32-bit data handling in a single register: This is the most important technical difference. In Standard Modbus, registers are 16-bit (2 bytes) and require reading two registers for a 32-bit value. In Enron Modbus, 32-bit values are mapped into a single register (4 bytes per register).
- 2. Specific address mapping: It uses predefined ranges for 32-bit data. The 5000 series (for example 45001 - 45999) is for Long Integers, while the 7000 series (for example 47001 - 47999) is for Floating Points.
- 3. Historical data and events: It supports special commands for extracting historical logs and alarm archives, unlike standard Modbus, which is designed almost exclusively for real-time reading.
- 4. No Offset: The requested address matches the register number exactly, eliminating the classic "+1 offset" typical of standard Modbus.
In summary: This emulation is essential to avoid communication errors (byte misalignment) when interfacing with devices that transmit native 32-bit data in the Oil & Gas sector.
Modbus Client Functions
In the central part of the screen you can find the Modbus functions supported by SerialTool.
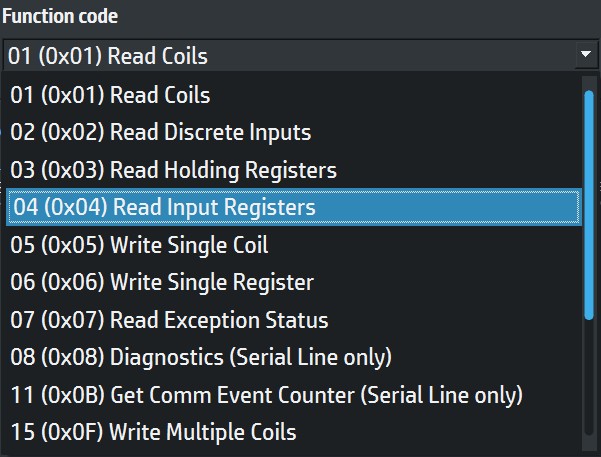
Functions supported for Modbus Client mode
The ModBus client functions can be summarized in the following table.
| Function Code | Action | Table Name / Description |
|---|---|---|
| 0x01 | Read | Discrete Output Coils |
| 0x02 | Read | Discrete Input Contacts |
| 0x03 | Read | Analog Output Holding Register |
| 0x04 | Read | Analog Input Registers |
| 0x05 | Write Single | Discrete Output Coil |
| 0x06 | Write Single | Analog Output Holding Register |
| 0x07 | Read | Exception Status |
| 0x08 | Diagnostics | Diagnostics (Serial Line only) |
| 0x0B (dec 11) | Read | Comm Event Counter (Serial Line only) |
| 0x0F (dec 15) | Write Multiple | Discrete Output Coils |
| 0x10 (dec 16) | Write Multiple | Analog Output Holding Registers |
| 0x11 (dec 17) | Report | Server ID (Serial Line only) |
| 0x16 (dec 22) | Mask Write | Holding Register |
| 0x17 (dec 23) | Read/Write Multiple | Holding Registers |
| 0x2B / 0x0E (dec 43 / 14) | Read | Device Identification |
Modbus Data Structures
Information is stored in the Server device in four different tables. Two tables store discrete on/off values (coils) and two store numerical values (registers). Coils and registers each have a read-only table and a read/write table. Each table has 9999 values. Each coil or contact is 1 bit and has a data address between 0000 and 270E. Each register is 1 word = 16 bits = 2 bytes and also has a data address between 0000 and 270E.
| Coil/Registers numbers | Data Addresses | Type | Table Name |
|---|---|---|---|
| 1-9999 | 0x0000 to 0x270E | Read/Write | Discrete Output Coils |
| 10001-19999 | 0x0000 to 0x270E | Read Only | Discrete Input Contacts |
| 30001-39999 | 0x0000 to 0x270E | Read Only | Analog Input Register |
| 40001-49999 | 0x0000 to 0x270E | Read/Write | Analog Output Holding Register |
Modbus Device
SerialTool allows the creation of a Modbus Slave device that represents the register mapping of the Slave device to which you intend to connect. This mapping is very important because it makes it possible to view, in a local table, the values present in the remote slave device.
Modbus Client Functions

Functions available for the Modbus Client
From the function bar it is possible to load a previously created device with the "Load Device" function, save the current device with "Save Device", and add single registers with "Add Item" or multiple registers with "Add Items" to the device mapping.
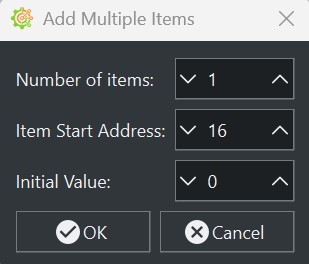
Adding Modbus registers to the Modbus device mapping
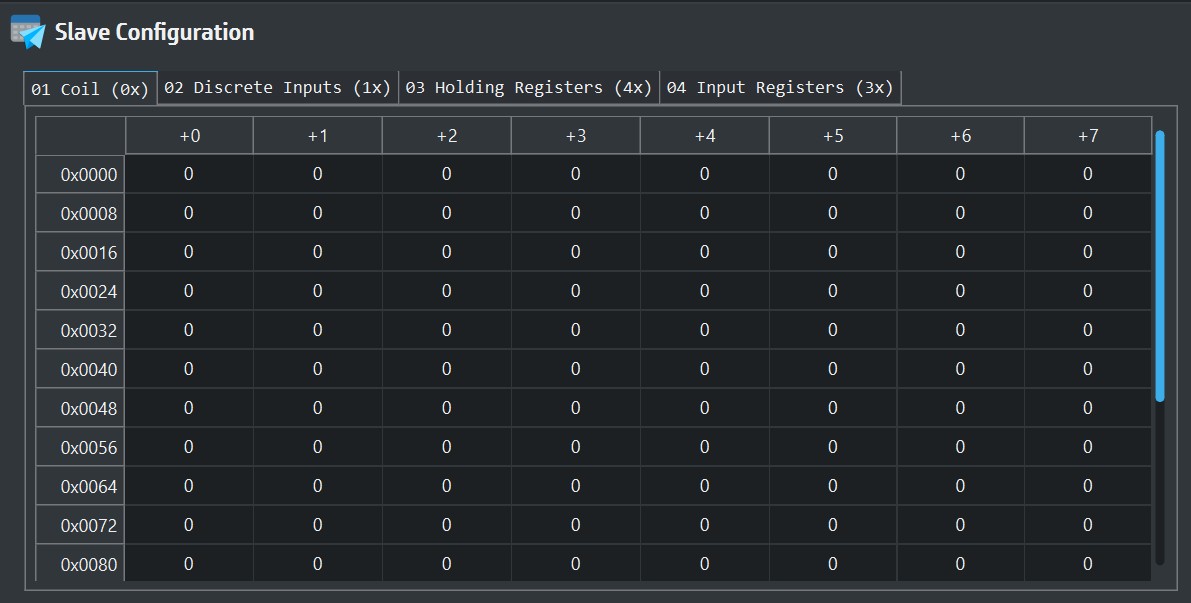
Modbus Slave device memory area (Modbus device)
Once the Modbus Slave device mapping has been created, SerialTool allows it to be saved for later use or its content to be exported in CSV, Text or PDF format for sharing and processing with third parties. The following image shows an example of exporting the mapping of a Modbus Slave device:
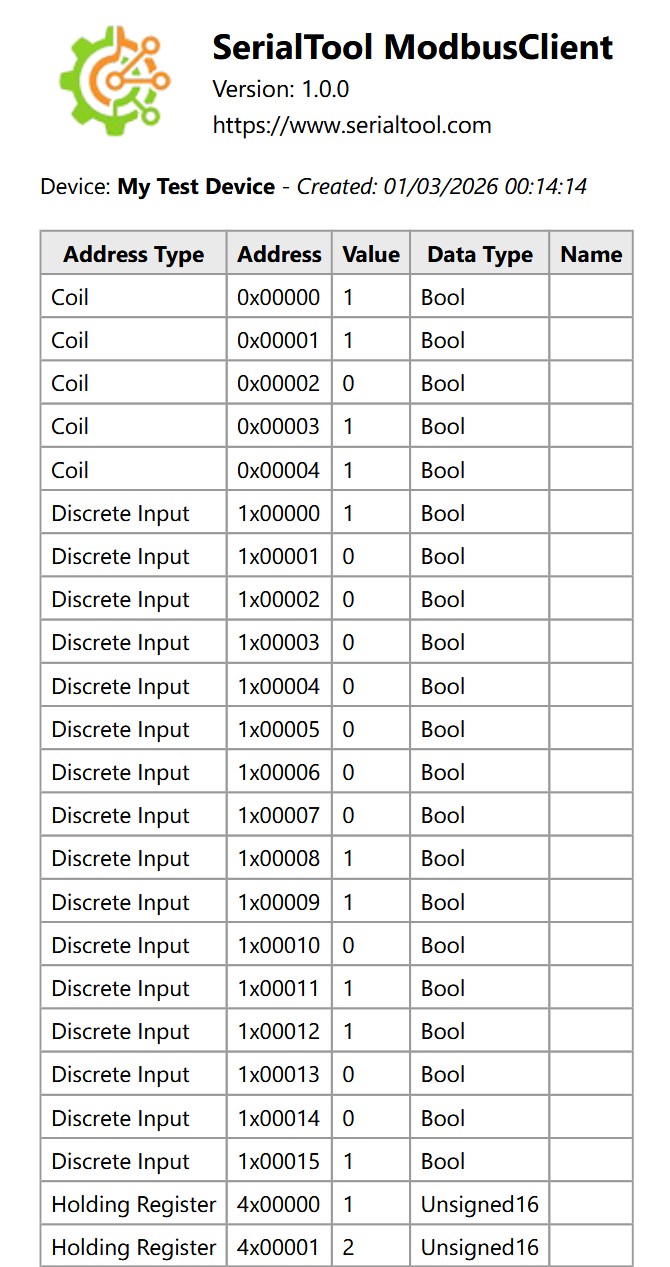
Example of PDF export of a Modbus Slave device mapping
You can download the PDF from this link.
Modbus Polling
Creating a Modbus Slave device makes it possible to perform polling, that is, scheduled reading of some registers of the slave device
to which you are connected.
To do this, you must first create and map the Slave, and add the register or registers for which you want to perform polling, as shown in the following figure:
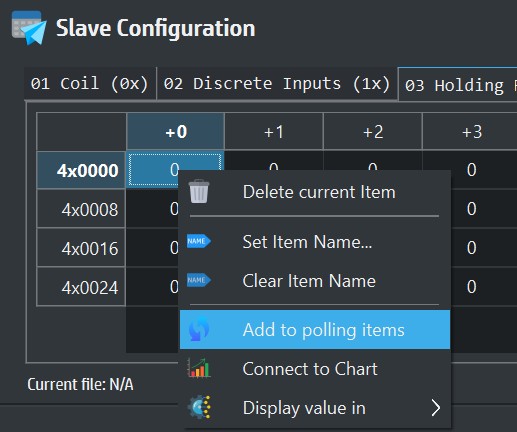
The image shows adding an item to polling toward the slave
Once one or more items have been added to polling, it is possible to start polling the items linked to the polling list.
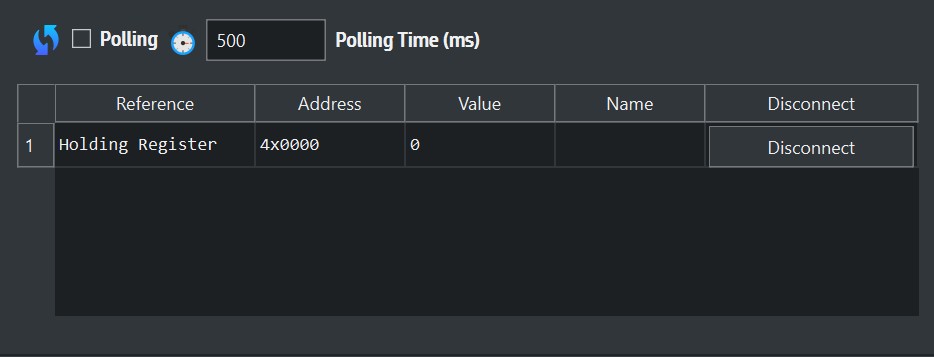
The image shows the items selected for polling
Access to Modbus Functions
The SerialTool Modbus client (Master/Polling) is designed to execute functions in three modes:

Modbus function execution
- "Execute from Device Table" - Executes the Modbus function with reference to the device mapping.
- "Execute Function" - Executes the direct Modbus function and shows the result in the log window.
- "Send Raw Data" - Sends a direct request formed by hexadecimal bytes and waits for the response.
Execute from Device Table
This mode executes the selected Modbus function by using the locally loaded or created device table directly.
The user can select the Modbus reference type, such as Coils, Discrete Inputs, Holding Registers or Input Registers, choose
the starting address and the number of elements to read or write, and then send the command to the slave with a single click.
The main advantage of this mode is that the result is reported immediately in the device map, updating the values
shown in the local table. In this way it is possible to have an ordered and persistent representation of the state of the remote device,
useful both during testing and during monitoring and maintenance activities.
When the command concerns a write function, SerialTool allows you to easily prepare the data to be transmitted by choosing the data
type, display format and content to be written into the selected registers. This mode is therefore particularly suitable
when you want to work directly on the logical structure of the Modbus device.
Execute Function
The Execute Function mode makes it possible to execute a Modbus function by selecting it directly from the list of available function codes,
such as reading coils, reading discrete inputs, reading holding registers, reading input registers, single or multiple writes and other functions
supported by the protocol.
In this case the operation is not limited to display in the device map only, because the result is reported in the application's log area.
This approach is particularly useful when you want to quickly verify the content of the received response,
test a specific Modbus function, or perform targeted tests on variable addresses and quantities without necessarily modifying the device
mapping.
The Execute Function mode is also very convenient for debugging, because it allows you to see immediately the outcome of the executed command,
any errors returned by the slave, and the information associated with the request and response.
Send Raw Data
This function sends and receives arbitrary commands sent to the slave in hexadecimal format.
It allows the user to manually type the sequence of bytes to be transmitted over the active connection, such as serial or TCP/IP,
without automatic frame construction by the software.
This function is very useful for advanced testing, reverse engineering, diagnostics or validation of Modbus devices and compatible
protocols. In practice, the client transmits exactly the bytes entered by the user, leaving full control over the packet content.
This makes it possible to simulate custom requests, test abnormal responses or send fully assembled frames prepared manually.
By enabling the option to wait for the response, SerialTool can also acquire the return frame received from the slave and display it in the traffic
log, allowing an immediate comparison between transmitted and received data.
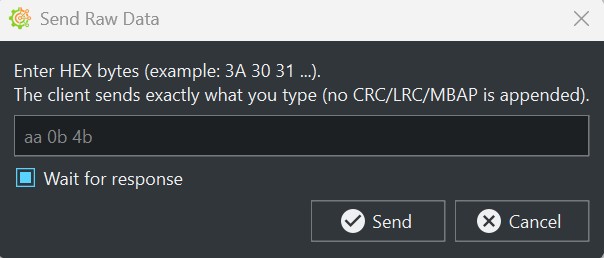
Sending Raw Data
Modbus Scanner Function
SerialTool includes a scanning function for the Modbus addresses of the connected Slave device.
This function makes it possible to quickly explore an address range starting from an initial address up to a final address,
also specifying the function code to use during the scan.
The scanner is particularly useful when the complete map of the remote device is not known precisely or when you want to
verify which addresses are valid and which contain significant data. For each queried address, SerialTool shows in the
table the function type used, the address, the value read and the outcome of the operation.
This mode significantly speeds up diagnostics and integration activities with third-party devices, because it allows you to
quickly identify areas of the Modbus memory actually used by the slave and export the scan results for later analysis
or sharing.
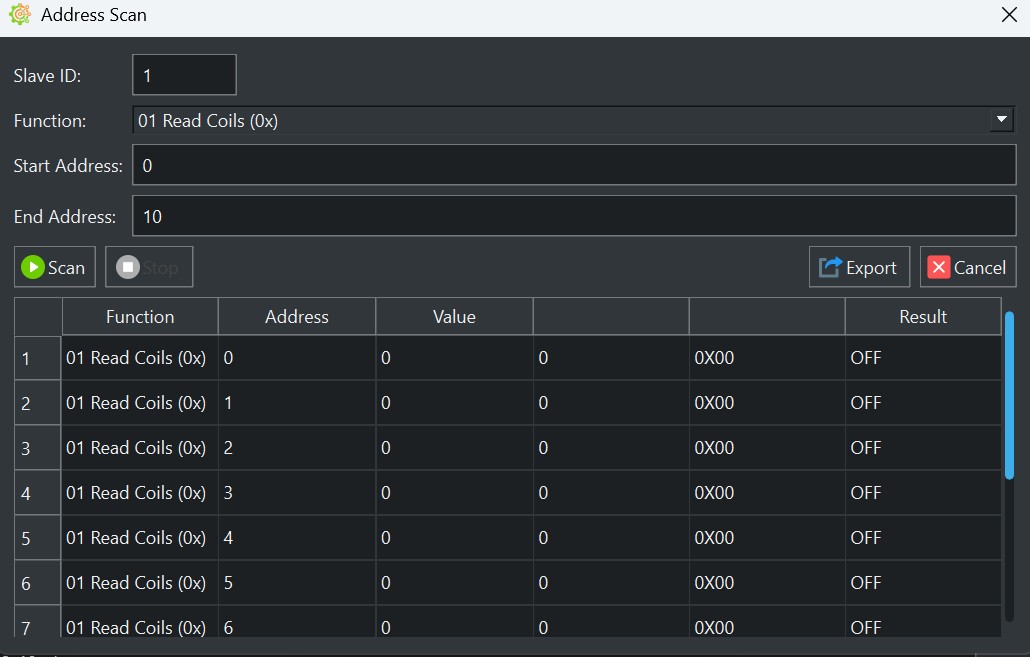
Address table
Chart of the Slave Modbus Registers
The values of the Modbus registers can be displayed in a chart.
This function allows one or more elements of the device mapping to be linked to a dedicated chart window, where the values
are plotted over time during polling or update operations.
Each register connected to the chart can be displayed with its own trace, identified by a specific color and by information such as
Modbus reference, address, current value and the name assigned to the element. In this way it is possible to easily observe the
time trend of analog variables, setpoints, measurements or numeric registers that change during device operation.
The chart function is particularly useful for monitoring, testing and dynamic analysis activities, because it allows you to see
immediately how the data evolves over time without being limited to tabular reading alone.
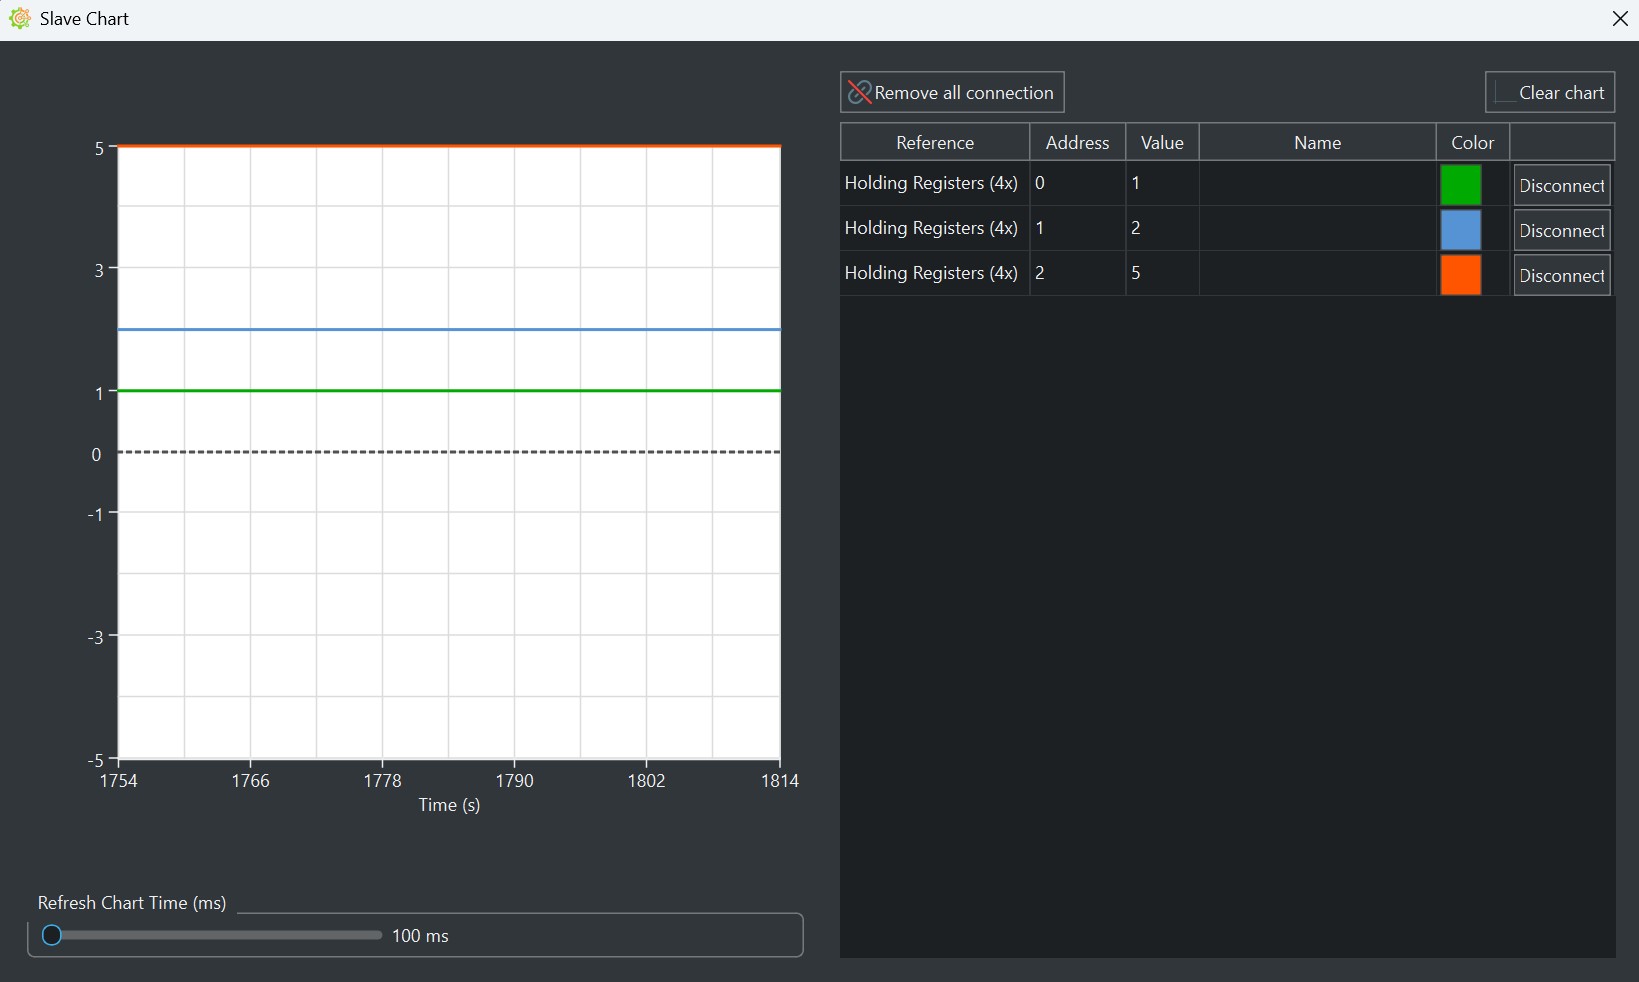
Modbus register chart
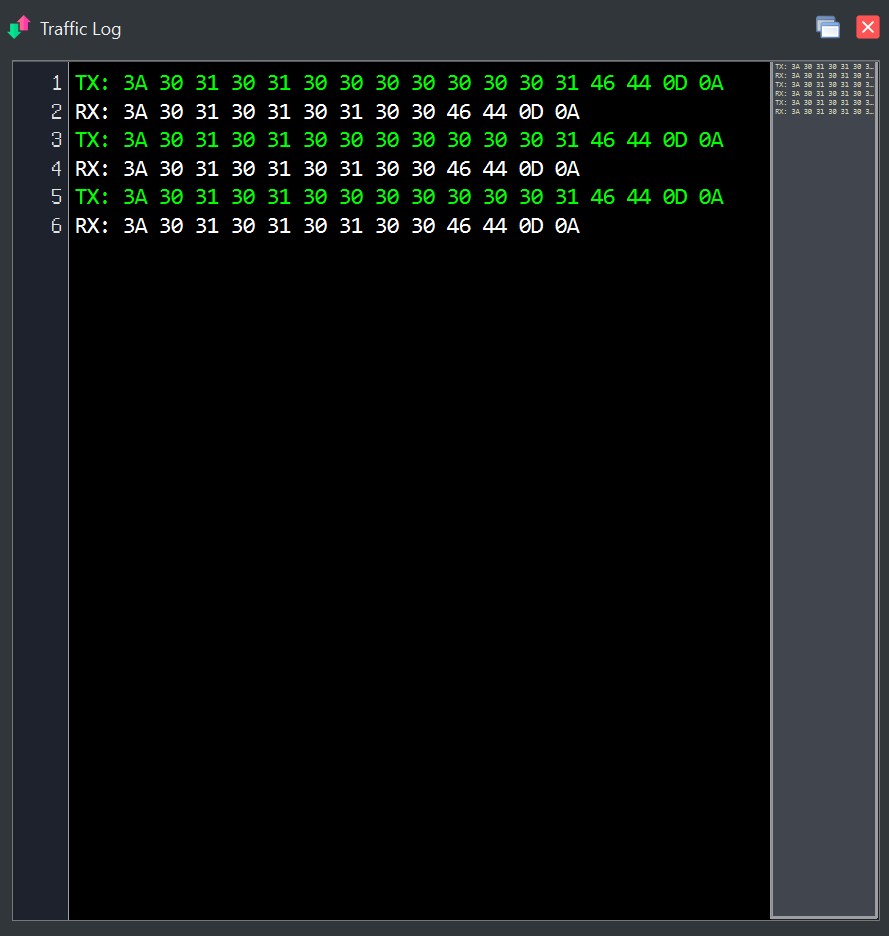
Modbus Traffic Log
All commands sent and received are shown in the Modbus traffic log window in bytes.
The traffic log is a fundamental communication debugging tool because it allows detailed visualization of
the data transmitted by the client and the data received from the slave device, showing the byte sequences in readable form.
Thanks to this window, it is possible to check the actual content of the frames, verify that the generated commands are correct and
diagnose any timeout issues, abnormal responses, Modbus exceptions or unexpected data. Traffic can be consulted during
normal client use, during automatic polling or during raw data sending.
The traffic window also offers advanced functions such as copying data in ASCII or hexadecimal format, saving to file,
searching within the content, line selection and graphical customization options such as colors, fonts, spacing and display settings.
This makes the traffic log not only a simple viewer, but also a very useful operational tool for developers, technicians and integrators.
Modbus traffic