Monitor, sniff, debug, and log the serial port

On this page you’ll learn three ways to analyze serial communication between devices (PC, controllers, embedded boards) and why SerialTool’s COM Sniffer is often the best solution: software-only, no wiring, transparent, and suitable for monitor/sniff/debug/logger use even for days.

What you’ll find

  • Chapter 1: what it means to monitor a COM port, how bytes/bits are structured and how serial sends them (start/data/parity/stop), plus TX/RX and baud rate.
  • Chapter 2: the classic method of physical sniffing with two USB↔serial adapters: connect only the RX to the TX lines of the two devices and share grounds. Perfect for a simple monitor/logger.
  • Chapter 3: the same concept applied to a Master PC talking to a Target Device via USB↔serial/RS-232/RS-485 converters (same protocol, different physical levels). Includes an overview of Modbus RTU/ASCII and industrial/CNC/embedded use cases (debug, firmware, reverse engineering).
  • Chapter 4: why it often pays to use SerialTool’s COM Sniffer: a serial port monitor based on a Windows kernel driver that intercepts data, IOCTL, signals, and parameters of ports already opened by other software. No cables, precise filters, export to pcap/pcapng (e.g., for Wireshark), and stability for long captures.

If your goal is to quickly analyze a third-party software or continuously monitor your application, start with Chapter 4 – COM Sniffer: it’s the fastest way to monitor, sniff, debug, and log without building a test bench.

Chapter 1 – Monitoring data from the COM port

1.1 What “monitoring a serial port” means

Monitoring a COM (serial) port means observing in real time the bytes traveling on the communication lines between the PC and the device. In monitoring we typically distinguish the two directions: TX (transmission from the PC to the device) and RX (reception from the device to the PC). A good monitor shows data both as text (ASCII/UTF-8 interpretation) and as hexadecimal (HEX), i.e., the raw bytes.

What it’s for
  • Verify that TX and RX occur with the correct parameters (baud, data bits, parity, stop).
  • Understand what is sent/replied, byte by byte, even when the text is not readable.
  • Diagnose configuration or protocol errors (e.g., Modbus/RTU, proprietary commands, etc.).

1.2 Bytes and bits: logical representation vs. serial transmission

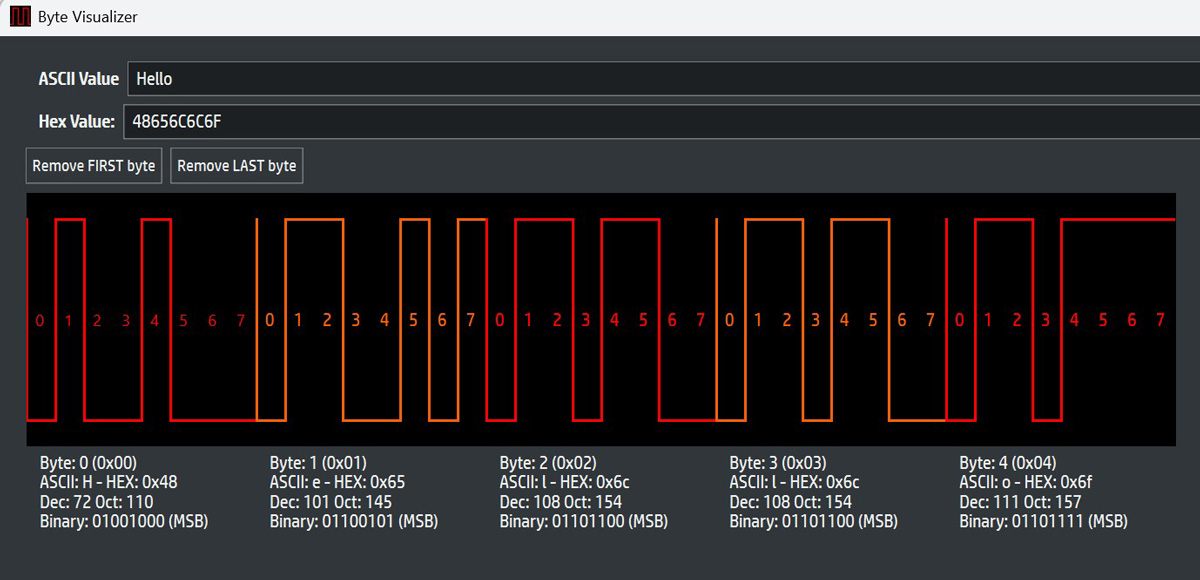
When we write the text Hello, the five characters are converted into five ASCII bytes: 48 65 6C 6C 6F in hexadecimal. A byte visualizer like SerialTool’s lets you see the logical waveform of the individual bits within each byte.

Bit waveform for the string 'Hello' (logical view in SerialTool’s Byte Visualizer)

Figure 1 — “Logical” representation of the bits for Hello

Each box highlights a byte (0x48, 0x65, 0x6C, 0x6C, 0x6F). Below each byte you’ll find ASCII, HEX, decimal, and binary. This view is useful to understand the content of bytes as they’re stored and processed by software.

How to read bytes in the logical view

  • The chart highlights 8 data bits for each byte (b7…b0). In memory we can list them as MSB→LSB (most significant to least significant).
  • This representation does not yet include serial protocol elements (start, parity, stop) and does not reflect the on-wire transmission order.

How bytes are transmitted on the serial port

On the physical RS-232/TTL line, each byte is encapsulated according to the serial frame:

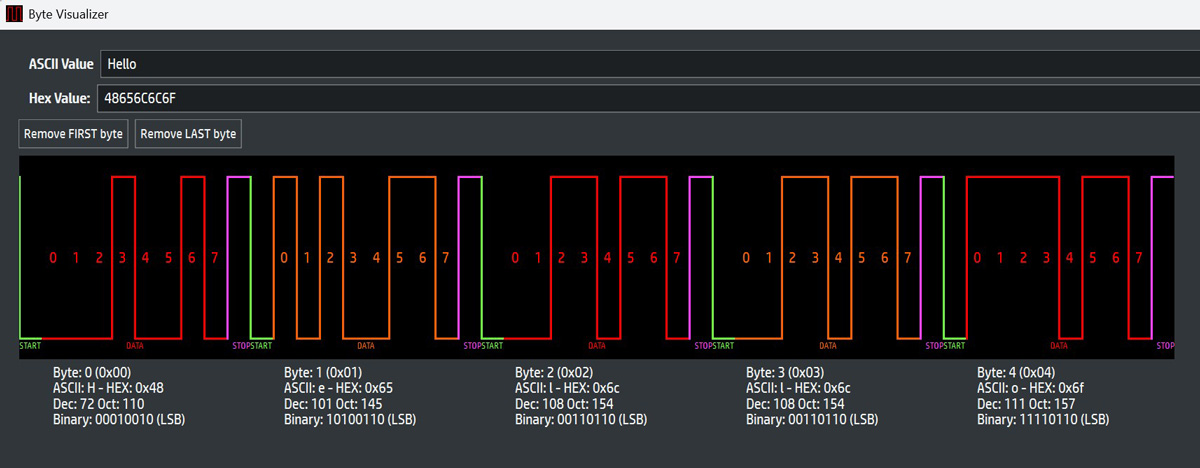
Start (1 bit, logic “0”)Data (7/8 bits, sent LSB-first)Parity (optional)Stop (1 or more bits, logic “1”).

  • Idle: the TX line is stable at logic “1” (mark). So the signal stays at 1 until the Start bit arrives.
  • Start bit: a transition to “0” (space) signals the beginning of the byte.
  • Data bits: data bits are transmitted in LSB-first order (least significant bit first).
  • Stop bit: return to “1” for 1 or more bits; ensures idle is restored.
  • Baud rate: determines the duration of each bit (e.g., at 9600 baud each bit lasts ~104.17 µs).
Bit waveform for the string 'Hello' (logical view in SerialTool’s Byte Visualizer)

Figure 2 — The same Hello bytes as serial frames on the line: for each byte you can see idle → start → data (LSB first) → stop

This view highlights the transmission order and the fixed bit timing imposed by the baud rate.

Note on RS-232 vs. TTL

  • At the TTL level (UART at 3.3 V/5 V), “1” is high and “0” is low.
  • At the RS-232 level the voltage levels are inverted (logic “1” ≈ negative voltage, logic “0” ≈ positive), but the start/data/stop sequence remains identical.

Quick example: time to transmit “Hello”

With 8N1 configuration (1 start, 8 data, 1 stop) each byte uses 10 bits on the line. At 9600 baud, that’s ~960 bytes/s. For 5 bytes (“Hello”) it takes ~5.21 ms.

Chapter 2 – Monitor/sniff, debug, and log a serial communication with two USB-to-serial adapters

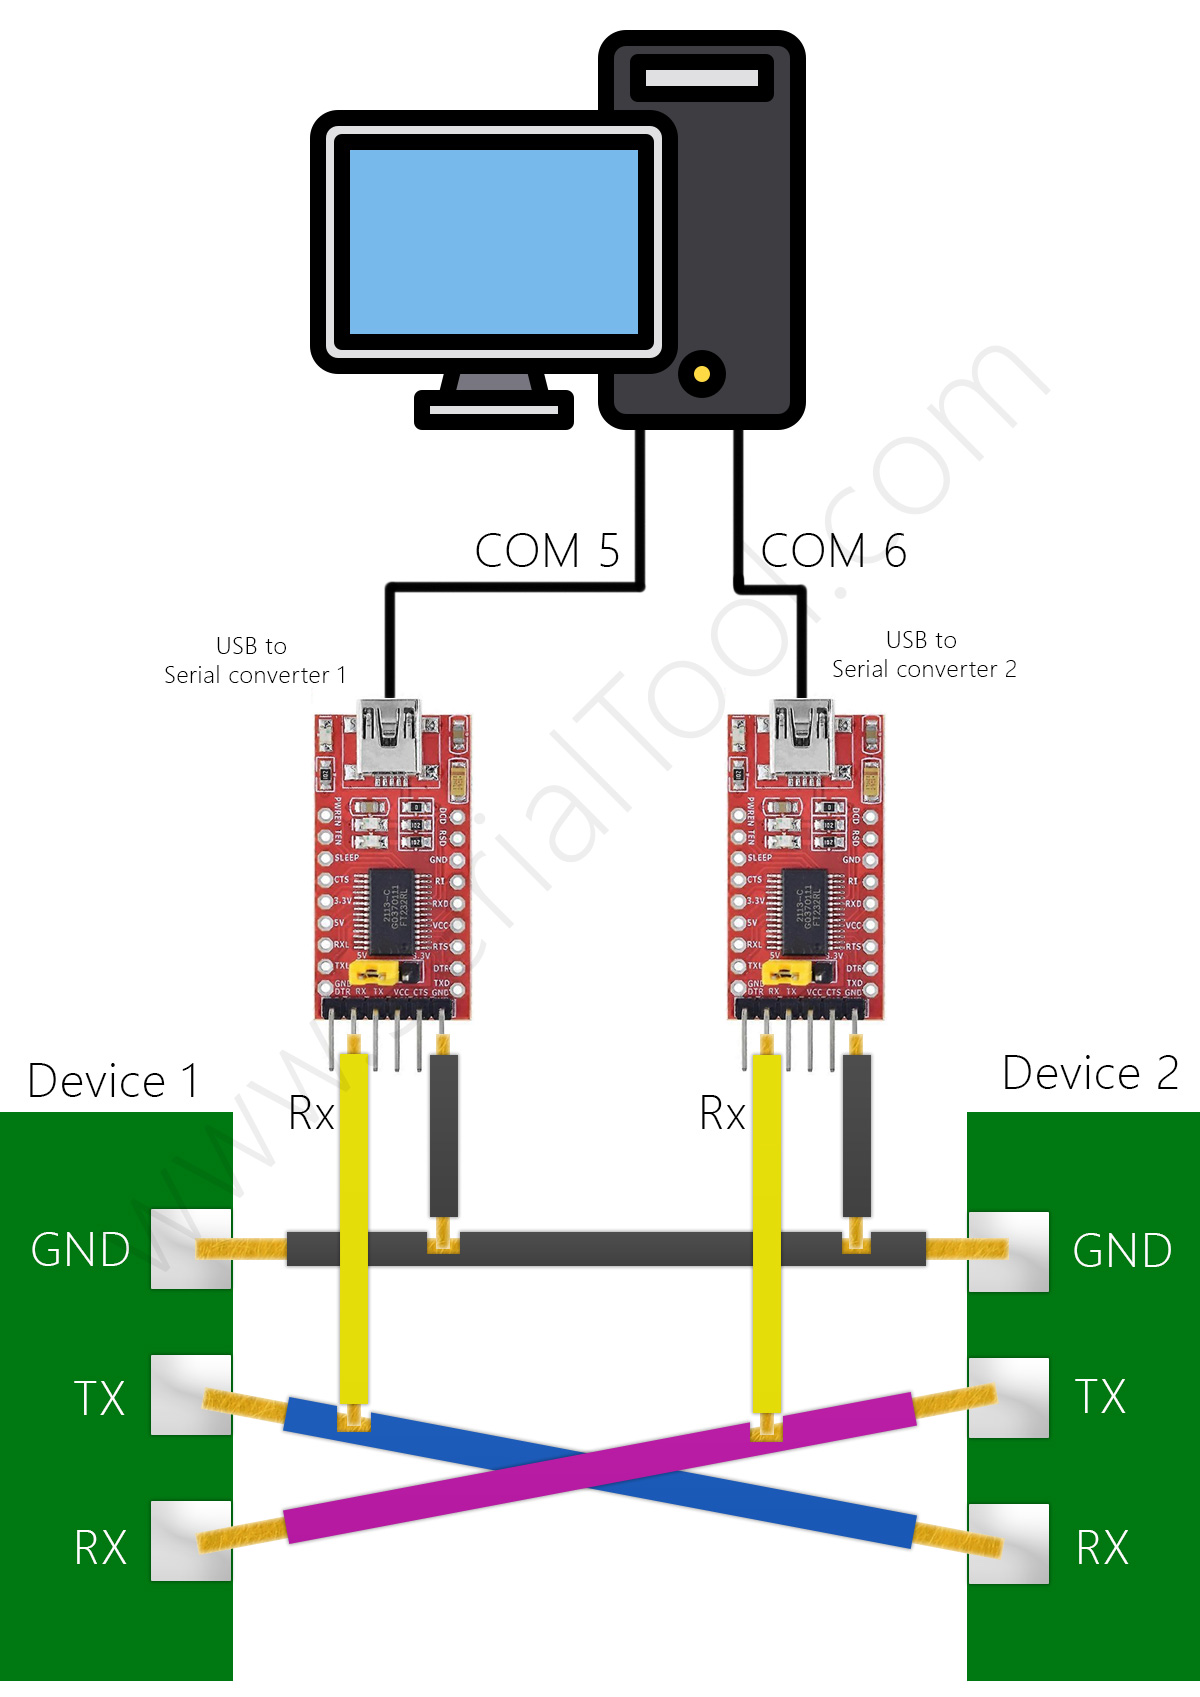
Physical wiring to sniff a serial communication with two USB-to-serial adapters

Hardware passive tapping diagram

The PC opens two ports (COM5 and COM6). Each USB-to-serial adapter uses only RX to “listen” to what each device transmits. Grounds (GND) are common. The purple and blue lines are the normal TX↔RX connection between the two devices.

2.1 Objective

Create a non-intrusive serial monitor/sniffer to observe, debug, and log the bytes exchanged between Device 1 and Device 2 without interrupting their communication.

2.2 Electrical connections (passive tapping)

  • COM5 (USB-to-serial #1): connect the adapter’s RX pin to Device 1’s TX (sniff the data sent by Device 1).
  • COM6 (USB-to-serial #2): connect the adapter’s RX pin to Device 2’s TX (sniff the data sent by Device 2).
  • Common GND: connect the ground of both USB-to-serial adapters to that of the two devices (shared reference for logic levels).
  • Do not connect the adapters’ TX to the bus: we stay in “high-impedance” listen-only mode, so we don’t disturb the line.
  • Do not power the devices from the adapters’ 5V/3.3V (VCC not used in tapping).

Level note: this method applies to UART/TTL (3.3/5 V) or buses with compatible drivers. For RS-232 (±12 V) do not connect a TTL RX directly: you need an RS-232↔USB converter or a dedicated RS-232 tap/monitor. In other words, if you want to log an RS-232 line, use the proper hardware.

2.3 Finding and setting the baud rate

To decode data correctly, the baud rate and parameters must match those of the devices (e.g., 9600/8N1). If unknown:

  • Check the device or protocol documentation.
  • Try the most common baud rates (9600, 19200, 38400, 57600, 115200...).
  • Measure with an oscilloscope/logic analyzer: bit duration is Tbit=1/baud (e.g., at 9600 baud ≈ 104.17 µs per bit).

2.4 Opening the two COM ports with SerialTool

  1. Connect the adapters: the system will see two ports (in this example COM5 and COM6).
  2. In SerialTool, open two sessions:
    • Session A → COM5, set baud/parity/stop like the devices (e.g., 115200/8N1).
    • Session B → COM6, same parameters as Session A.
  3. Put both in monitor (RX-only): on COM5 you’ll see the bytes sent by Device 1 and on COM6 those from Device 2.
  4. For debug use the HEX view and timestamps; for logging save to file (CSV/pcap/raw) for later analysis.

In this scenario you act as a passive physical man-in-the-middle: you monitor/sniff data electrically without altering the signals.

2.5 Control pins excluded in this example

The diagram focuses on TX/RX data and does not monitor control pins (e.g., RTS/CTS, DTR/DSR, DCD, RI). For many applications they’re unnecessary; however, if the devices use hardware flow control, you may want to “tap” those lines with dedicated probes.

Further reading: RS-232 (Wikipedia), RS-232 – Signals, Hardware flow control, UART.

2.6 Practical tips for a stable monitor/sniffer

  • Use short cables and a solid common GND; avoid ground loops.
  • Most UART drivers tolerate two RX inputs (fan-out) on one TX line, but avoid unnecessary loading.
  • Always align port parameters across both sessions (baud, data, parity, stop).
  • For RS-485 or differential buses you need specific adapters and different tapping rules.

With this technique you can reliably monitor, sniff, debug, and log serial communications between two devices using common tools: two USB-to-serial adapters + SerialTool.

Chapter 3 – Sniffing/monitoring the serial link between “Master PC” and “Target Device”
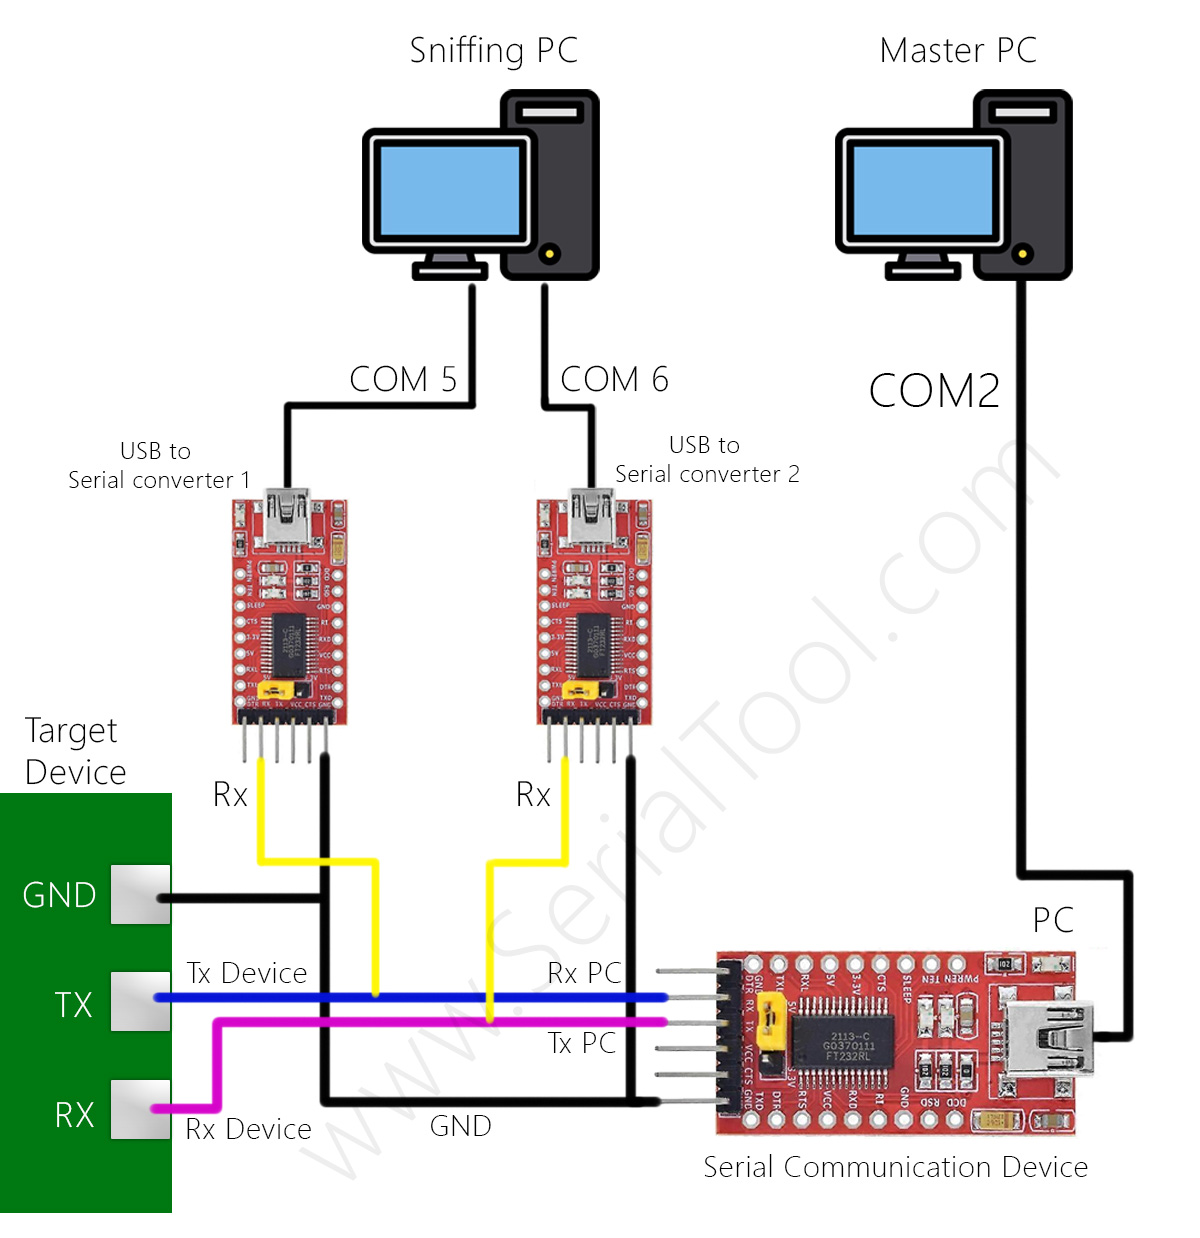
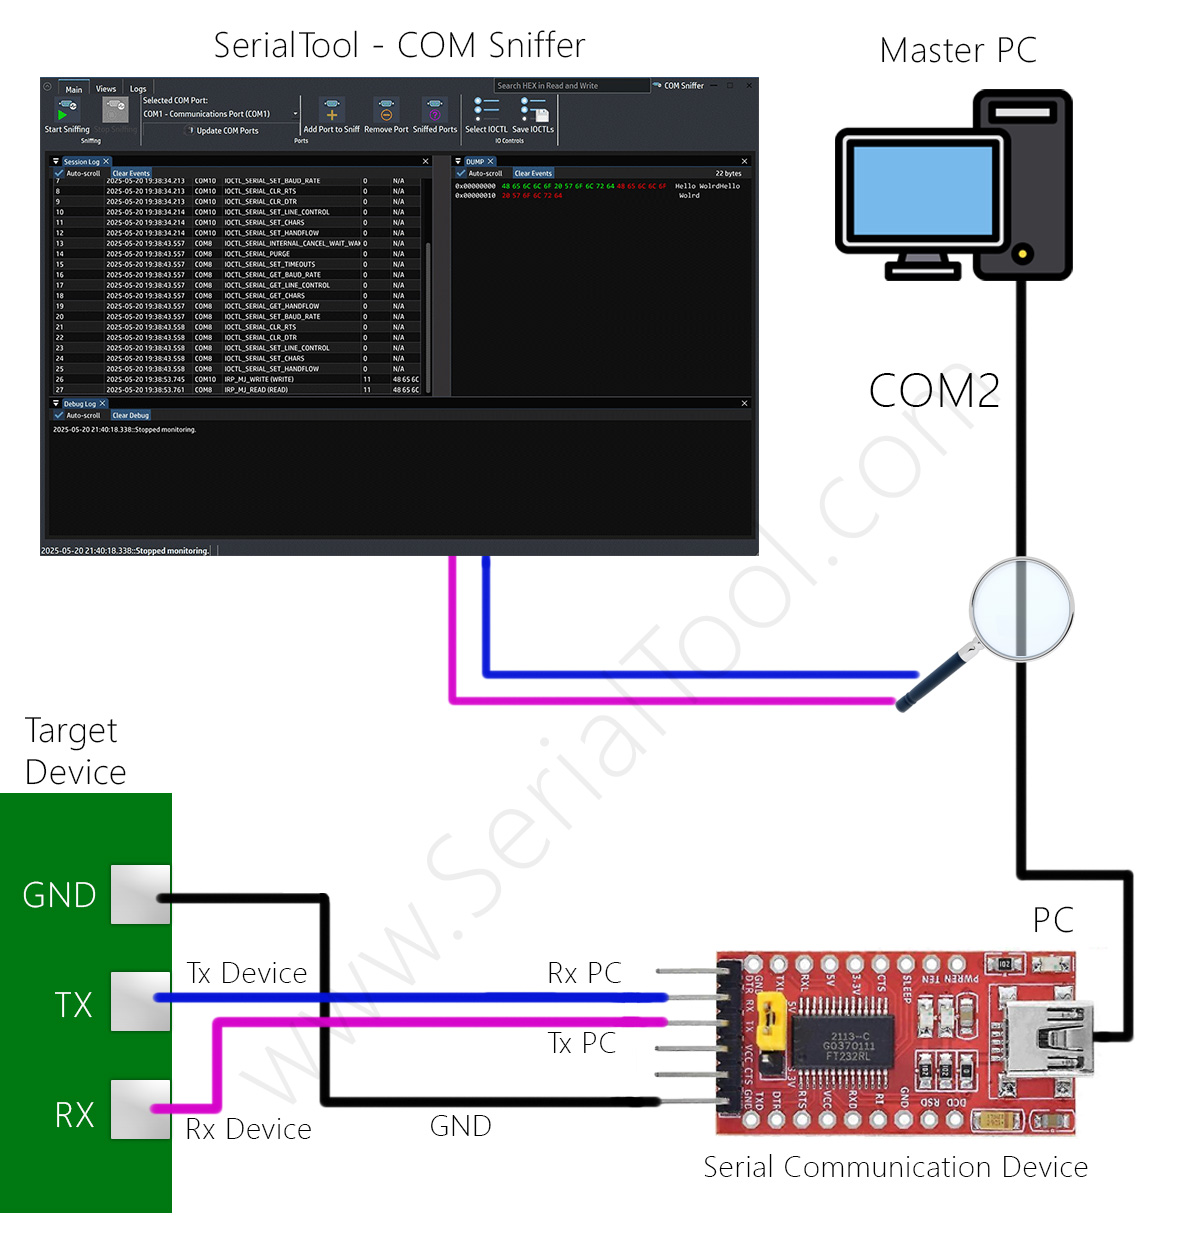
Sniffing communication between Master PC and Target Device with two USB-to-serial adapters on a second PC

Communication between a hardware device and a PC via serial

The Master PC (right) communicates with the Target Device through a Serial Communication Device (typically a USB↔Serial converter: UART/TTL, RS-232 or RS-485). The Sniffing PC (left) opens two ports (COM5 and COM6) and, with two USB-to-serial adapters, passively listens to the lines: on COM5 connect RX to the Device’s TX, on COM6 connect RX to the PC’s TX. Grounds (GND) are common.

3.1 Purpose and concepts

We want to monitor and sniff the bytes traveling between software on the Master PC and the Target Device, without interfering with the communication. It’s a typical passive physical man-in-the-middle: two USB-to-serial adapters connected only in RX “read” each direction. This is useful for debug, protocol analysis, and as a logger for auditing or reverse engineering.

3.2 Connections (step-by-step)

  1. COM5 (Sniffing PC) → connect the adapter’s RX to the Device’s TX (listen to what the Target sends).
  2. COM6 (Sniffing PC) → connect the adapter’s RX to the PC’s TX (listen to the Master PC’s commands).
  3. Common GND between the two adapters and the two devices (shared reference).
  4. Do not connect the Sniffing PC adapters’ TX: we remain listen-only (high impedance), without disturbing the line.

In SerialTool open two sessions: COM5 and COM6. In both, set the baud rate and format identical to those used by the Master/Device (e.g., 115200-8N1). If you don’t know the baud, try common values or measure bit duration with an oscilloscope/logic analyzer.

3.3 Same protocol, different levels: UART/TTL, RS-232, RS-485

The asynchronous serial protocol (start, 7/8 data bits sent LSB-first, optional parity, 1+ stop) is the same. Only the physical level the bits travel on changes:

  • UART/TTL (3.3 V/5 V): single-ended signals, “1” high / “0” low.
  • RS-232: inverted and ± voltage levels (typically ±3…±12 V), still single-ended.
  • RS-485: differential on A/B pair, often half-duplex multi-drop; a common reference ground is recommended.

Therefore use the correct adapter: USB↔TTL for UART, USB↔RS-232 for RS-232, USB↔RS-485 for RS-485. The frame remains identical, but electrical levels and topology (differential/termination) differ.

3.4 Where it’s used (CNC, industrial, etc.)

This setup is common in CNC, industrial machinery, PLC/HMI, robotics, scales, POS, sensors, instruments, building automation, and in general any system where a PC/PLC controls a device via serial. The sniffing method described here lets you monitor/sniff/debug/log traffic for functional analysis, fault diagnosis, command tracing, and validation.

3.5 Modbus over serial

Serial ports often carry Modbus RTU/ASCII, a widely used master/slave (now client/server) protocol in industry. The Master sends requests (read/write of coils and registers) and the Device replies. SerialTool includes a Modbus client to quickly query registers (diagnostics and testing), alongside the monitor/hex viewer useful to view raw frames (address, function, data, CRC).

3.6 Firmware update and parameterization

In the embedded world serial is widely used for firmware updates or passing parameters to the Target. Examples: bootloaders on custom boards, ecosystems like Arduino, various microcontrollers. Here a developer may have two needs:

  1. Debug the application that talks to the Target (check commands, timing, errors).
  2. Reverse engineering an existing protocol (there’s a “closed” Master software talking to a board; I sniff to understand its messages and then replicate them with my own software).

3.7 Practical notes and tools

  • This setup typically requires two PCs (the Master and the Sniffing PC) and at least two USB-to-serial converters for bidirectional sniffing.
  • For RS-232 use an RS-232 tap/converter; for RS-485 connect a receive-only interface to the A/B terminals (respecting termination and polarity). On half-duplex RS-485 you’ll infer direction from timing context.
  • We exclude control pins (RTS/CTS, DTR/DSR, DCD, RI); if the system uses hardware flow control, consider dedicated probes.
  • In SerialTool you can enable HEX views, timestamps, and save as a logger (text/CSV/pcap) for later analysis.

In short: same serial protocol (asynchronous frames), different physical levels (TTL/RS-232/RS-485). With passive two-RX tapping and software like SerialTool you can reliably monitor, sniff, debug, and log communication between a Master PC and a Target Device.
Chapter 4 – COM Sniffer: monitor/sniff/debug/logger without physical wiring

SerialTool COM Sniffer: monitor a serial port already opened by software, without physical connections

COM Sniffer - Serial Port Monitor

With SerialTool – COM Sniffer you don’t need the connections from Chap. 3: the traffic between the Master PC (third-party proprietary software) and the Target Device is captured directly by the system, transparently and non-intrusively.

4.1 What COM Sniffer does

COM Sniffer is a serial port monitor that intercepts communication on a COM port already opened by another program, allowing you to monitor, sniff, debug, and log the entire traffic (TX/RX) without touching cables, without extra hardware and without affecting the operation of the Master PC or the Target Device.

4.2 How it works: kernel driver

The core is a kernel driver for Windows that inserts itself into the serial port stack and selectively observes:

  • Data buffers read/written (TX ↔ RX) with clear directional separation;
  • IOCTL (Input/Output Control): opens/closes, settings for baud/parity/stop, timeouts, control signals (RTS/DTR/CTS/DSR/DCD/RI), etc.;
  • Events/SIGNALS and port status (line status, modem status).

The driver is powerful yet the interface is simple: you can filter by type (data only, configuration IOCTL only, signals only, etc.) to focus on what matters. It’s designed for long-term captures (hours/days) stably, to monitor your app or a third party. Note: it works only on Windows because it relies on kernel-mode drivers.

4.3 Why it’s better (in many cases) than physical wiring

  • No “lab” of two PCs + two USB-to-serial: save time and reduce points of failure.
  • Zero electrical impact: you don’t load the lines, no risk of ground loops.
  • See everything between app and driver: data, IOCTL, signals, even on multiple ports simultaneously.

4.4 Logging and export for protocol analysis

You can save directly to file as a logger (text/CSV) or export to pcap/pcapng for analysis in Wireshark. This is extremely useful for industrial protocols like Modbus RTU/ASCII: with frames and timestamps you can validate timing, CRC, function sequences, etc.

4.5 What you can observe

  • TX/RX data separately, in ASCII and HEX, with timestamps;
  • Port parameters set by the software (baud, 7/8 bits, parity, stop, timeouts);
  • Control signals and IOCTL (RTS, DTR, CTS, DSR, DCD, RI) and state changes;
  • Open/close events and errors (overrun, framing, parity).

4.6 When to use it

  • Debug your serial application without changing code/wiring;
  • Long-term monitoring of third-party applications for audit/diagnostics;
  • Reverse engineering proprietary protocols (where lawful) to replicate functions with your own software;
  • Validation of standard protocols (e.g., Modbus) and handshaking signals.

4.7 Notes and further reading

COM Sniffer works at the system level with the logic of the asynchronous serial protocol (start/data/parity/stop). If the application uses different physical levels (UART/TTL, RS-232, RS-485) the capture remains identical, because it happens above the electrical level, within the Windows COM port stack.

Useful links: Serial port · UART · RS-232 · RS-485 · IOCTL · Windows kernel drivers · Wireshark · Modbus.

In short: SerialTool’s COM Sniffer is a “software-only” solution to monitor, sniff, debug, and log a serial port opened by other programs, with a reliable kernel driver, targeted filters, and export for advanced analysis.